Mar 8, 2007

New Strategy needed


Our market has re-bounded in line with other regional markets. These markets have obviously benefited from a 120-point re-bounce for Dow Jones Industrial Index overnight. Today's trading has been fairly brisk. Before we get carried away, let's look at some of the other global equity markets and their present precarious technical position.

Dow Jones Industrial Index.


London's FTSE Index.


Bombay's BSE Index.


Hang Seng index.

All the above indices have clearly broken below their uptrend line. The following indices are at their uptrend line or just tested & re-bounded from their uptrend line. This includes Shanghai's SSE Index (surprice?).
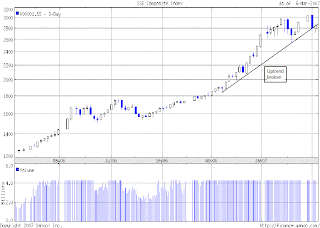


And, Nikkei 225 Index.


From the above, I believe that the worst in the global equity market may not be over yet. For those who have large position in the market, my recommendation is to reduce your position as the current re-bounce goes higher. For example, if you have a sizable position in Tenaga, you may want to use the current re-bounce to reduce your holding of Tenaga if its share price reaches RM11.70-12.00. If you manage to do so, you can buy back the same amount of Tenaga shares if its share price weakened back to its medium-term uptrend line support at RM10.20/30 (see the chart below).


Chart: Tenaga's daily chart as at March 6, 2007

Nobody is sure exactly where the market is at this moment. Here, an amusing look at one possible scenario of the next market direction.

Mar 2, 2007

All eyes on the Shanghai Stock Exchange CI

All eyes on the Shanghai Stock Exchange CI

Many were not aware of the raging bull in the Shanghai stock market until the recent rude awakening. The Shanghai Stock Exchange Composite Index ('SSECI') has gained nearly 100% in 6 months, from just under 1600 point in August last year to 3000 point in January this year (see Chart 1 below).


Chart 1: SSECI's chart from August 2006 until Mar 1, 2007

From Chart 2 below, we can see that the SSECI's uptrend picked up pace in August last year & went into a parabolic rise from mid-November last year. This sent the SSECI up 60% in just 2 months; from 1850 point from mid-November to hit a high of 3000 point on January 24. Thereafter, the SSECI underwent an orderly correction & dropped about 14% over a 9 days' period to hit a low of just under 2600 point on Feb 6 before recovering. The SSECI has then tested & exceeded its recent high of 3000 point marginally. On February 28, amid concerns that the government might crack down on illegal investments that help drive benchmarks to record level, investors dumped their shares & the SSECI took a sharp 9.2%-plunge.

I believe that there is further correction ahead for the SSECI. The index could have put in a double top reversal. It is likely to test the tentative uptrend line at 2650 (marked as 'A'). If this support is broken, it may drop to the next uptrend line supports at 2200 & then 2000 (marked as 'B' & 'C', respectively). Any further weakness could continue to unnerve investors' throughout the region.


Chart 2: SSECI's chart from April 2006 to Feb 27, 2007

The main similarity between our KLCI and the SSECI is the sharp rise in the past 2 or 3 months. On the other hand, we must bear in mind that the SSECI has been rising for about 18 months while our KLCI has only broken above its 3-year consolidation pattern about 5 months ago (in October last year). Our stock market has no doubt benefited from the same strong foreign buying as that of the other markets in this region (including the Shanghai stock market). At some point over the next 1-3 weeks, investors will realize that our market should be treated differently. Only then, will we see a recovery in this market.